A recent thread on Mountain Project caught my interest, when someone asked why US guidebooks give the length of rappels in feet but ropes are sold in metres. At the time of writing the thread has just reached seven pages of debate on the merits of U.S. customary units vs. the SI units. While the thread title mentioned “imperial units”, it’s worth noting that the imperial units are actually different from the U.S. units. This is why the British pint of 20 fluid ounces is larger than the American pint of 16 fluid ounces. (Of note, those fluid ounces also differ by about 4%.) Just to kick a little more sand at the U.S. system, I’ll mention the odd bit of trivia that the international foot and the U.S. survey foot are also very slightly different. (Only some U.S. states use the survey foot.)
But I digress… the argument online rather quickly diverted into a debate about the merits of decimalization, with at least one poster very much attached to inches divided into halves, quarters, and eighths. While decimalization is not strictly the same as metrication (or “going metric”), it certainly is strongly associated with it! It occurred to me that a few other concepts also come along with metrication, which is what this post is about. I suspect many non-metric folk are largely unaware of these side benefits, so this post is for them.
Background
I’ve picked up the ideas here from a few different places. The concept of cooking by weight came from cooking in Europe, and trying to calibrate a cup of brown sugar. The issue with carpentry was a mix of my own experience and a few best practices learned from the late Patrick Naughtin’s site on metrication. Finally, the use of UTM-based grid systems for land navigation first caught my eye when looking for a better way to use a GPS device.
Cooking
Ever measure a cup of brown sugar? Notice how easily you can compress it into the measuring cup. How confident are you that your cup contains as much sugar as the recipe author had in mind? A similar situation occurs even with something as innocuous as flour.
J. Kenji Lopez-Alt, the managing editor of the blog Serious Eats, once asked 10 people to measure a cup of all-purpose flour into a bowl. When the cooks were done, Mr. Lopez-Alt weighed each bowl. “Depending on how strong you are or your scooping method, I found that a ‘cup of flour’ could be anywhere from 4 to 6 ounces,” he said. That’s a significant difference: one cook might be making a cake with one-and-a-half times as much flour as another. — Farhad Manjoo, Tipping the Balance for Kitchen Scales
While there’s no strict need for the metric kitchen to use prefer measurements by weight instead of by volume, the metric kitchen does seem to have a preference for the kitchen scale. Using a single bowl and your scale’s tare button, you can measure each ingredient down to the gram. It may even be a needless precision, as Kenji discusses in a later post defending his use of volume-based measurements.
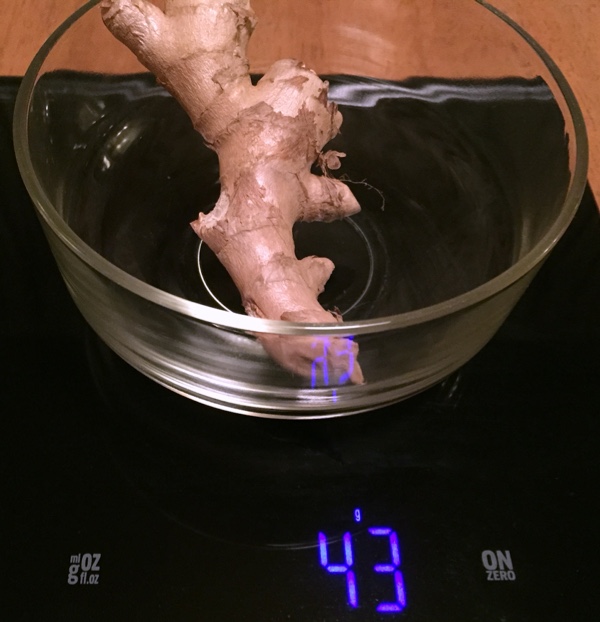
43 grams of ginger
Even so, for baking such precision is appropriate, and when not baking at least you have a comfortable baseline to fall back on. You don’t have to worry if the author’s idea of a tomato is small or large. (The question might seem silly to some, but having grown up in an agricultural paradise and then seeing what passes for produce on the far side of the country, I can say the difference is significant.)
Carpentry
If you’ve done a bit of carpentry in feet and inches, no doubt you’ve had to add up a few dimensions. Take the example of 3′ 4 3/8” + 2′ 1 1/4” + 4′ 10 9/16“. Now, pull out a stopwatch and tally those up. Fun, wasn’t it. Are you sure you got the correct answer? Now, consider what someone in the metric world is likely to encounter: 1020 mm + 640 mm + 1480 mm. I’m guessing you reached 3140 mm quite a bit faster than 10′ 4 3/16“, and if you reached for a calculator I bet it was easier for you to use as well.
Tossing fractional parts makes such sums much tidier and less error-prone, but there’s one other practice here to point out. I’m sure someone’s wondering why those amounts aren’t in centimeters, and I’ll tell you why. The metric system is much tidier if you stick to multiples of 1000. Imagine the fun of toggling between millimetres, centimetres, decimetres, metres, and more at a construction site; you’ve just re-introduced plenty of opportunity for errors to sneak back in.
How does this work in practice? Metrication programs that discourage the use of the irregular prefixes like hecto, deca, deci, and centi tend to be much more successful. Having all dimensions at the job site done in millimetres means no unit conversion (even if it’s only sliding a zero). This also means that your plywood comes in sizes like 1200 x 2400 mm rather than swapping to metres. If you reach the thousands end of the scale, don’t jump to the next unit just to trim off the zeros! A side benefit is that if you give workers measurements in millimetres, you’re more likely to get millimetre accuracy.
Land Navigation
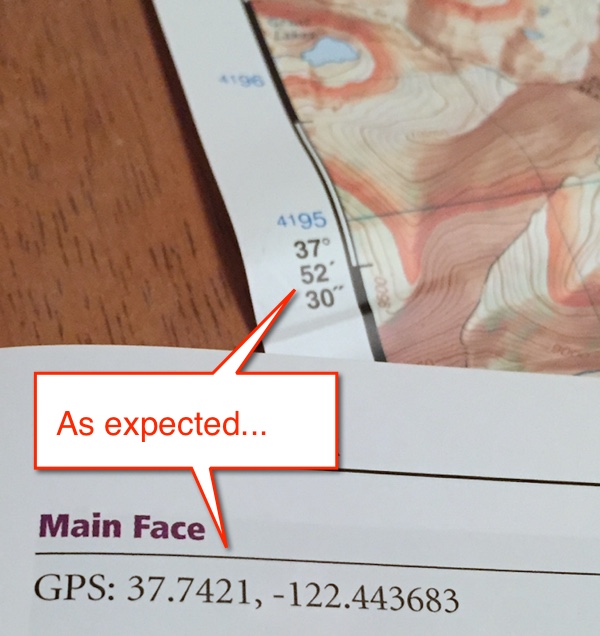
To many people GPS coordinates are latitude and longitude (lat/lon) numbers that they can read off a guidebook, punch into their handheld device, and follow the arrow until they arrive. Some may even reverse the process to mark a water cache in the desert, or a preferred campsite or hunting location. But, hand someone coordinates and a paper map, and how likely are they to point out the specified location? Give them a pair of coordinates, and will they be able to tell you how far apart they are?
This case has two issues; the first is the variety of ways those coordinates get expressed, and the second is the problem of using spherical coordinates for locations on a scale better suited to a Cartesian grid.
Let’s begin with the wide variety of ways those spherical coordinates can be used to express the location of a single point on Earth:
39.366868°, -120.335266°
39° 22.01210', -120° 20.11597'
39° 22' 00.726", -120° 20' 06.958"
39:22:00.726 N, 120:20:06.958 W
39N 22 01, 120W20 07
39-22.012N 120-20.116W
Notice how, apart from the initial measurement in degrees, the smaller figures can vary wildly. Imagine a decimal confused for a tick mark or vice versa, and consider how likely these are to make it across a voice transmission un-mangled. Assuming they do make it through intact, can you plot them on a map? I suspect there’s a universal law that says the lat/lon markings on your map will be in any format except the one in which your coordinates were provided.
Next question: given a few adjacent coordinates, can you tell how far apart they are? You might know that a nautical mile (1852 m) is roughly a minute of latitude, but a minute of longitude is completely dependent on how far north you are: it’s about 1850 m at the equator, 1310 m at 45° North, and 480 m at 75° North. This can be a chance to dredge up some rusty trigonometry skills! (Note: I said spherical earlier, but don’t forget to correct for the Earth being closer to an ellipsoid.)
Enter the UTM grid. A few variations are in use, but it sections the globe into 60 zones, each 6° wide. Within each zone, a simple x, y grid system is used. For the Northern Hemisphere, the equator marks the y-axis zero value, and for each zone an x-axis zero value is positioned 500,000 m to the west. (In the Southern hemisphere, the equator is assigned a value to 10,000,000 m to avoid dealing with any negative numbers.)
This means that within each zone locations can be represented using simple Cartesian coordinates. Most good maps include UTM markings at regular intervals, or even overlay a grid, meaning you can easily translate coordinates to and from map locations, and simple math can tell you the distance between two locations. In metres, of course.