As NOAA recently announced their decision to sunset raster chart production over the next 5 years, some may find this useful.…
Many people are familiar with using apps such as Navionics for basic navigation. To me, the functionality of such apps is often severely limited, almost more a toy than a serious tool. That needn’t be the case.
Instead, I’d like to present some options for effective electronic navigation. The challenge here is finding applications that support them, of which there are few. My preference is an app called SEAiq; it has an enterprise version with even greater functionality, but we’ll stick with the more affordable recreational version for now.
SEAiq has a few particular tools that are quite useful: the ability to create electronic bearing lines (EBLs), variable range markers (VRMs), mariner’s notes, and course vectors for both your own ship and for AIS targets. Some of these can also be combined, for example you can attach a VRM to an AIS target.
Good Habits
To start with there are a few good habits to develop when going electronic:
- Never run down your batteries, and have a backup power supply ready to go. (You wouldn’t run out of gas in your car, why do it with your electronics?)
- Remember to lock tools from editing; you don’t want to accidentally move them.
- Export your routes, tools, and notes once planning is complete: load them on each device you will have with you (laptop, tablet, phone, etc.).
- Know when chart updates are available, and download them regularly.
Parallel Indexing
The traditional method of parallel indexing is to plot a line parallel to the planned course but offset by a given amount. The offset may be determined based on a safe distance from known hazards, or it could simply be the maximum amount of cross track error considered acceptable.
A variation on this is to place VRMs around fixed hazards and add lines tangent to them; should our ship reach that line we know we are heading off course and must make a correction. Always remember to use a fixed object as your reference point; if you must use a floating object its physical position must first be verified.
Here I’ve placed the green line at safe offsets from both Mile Rocks and the South Tower of the bridge; as long as we stay above the green line we’re in good shape:
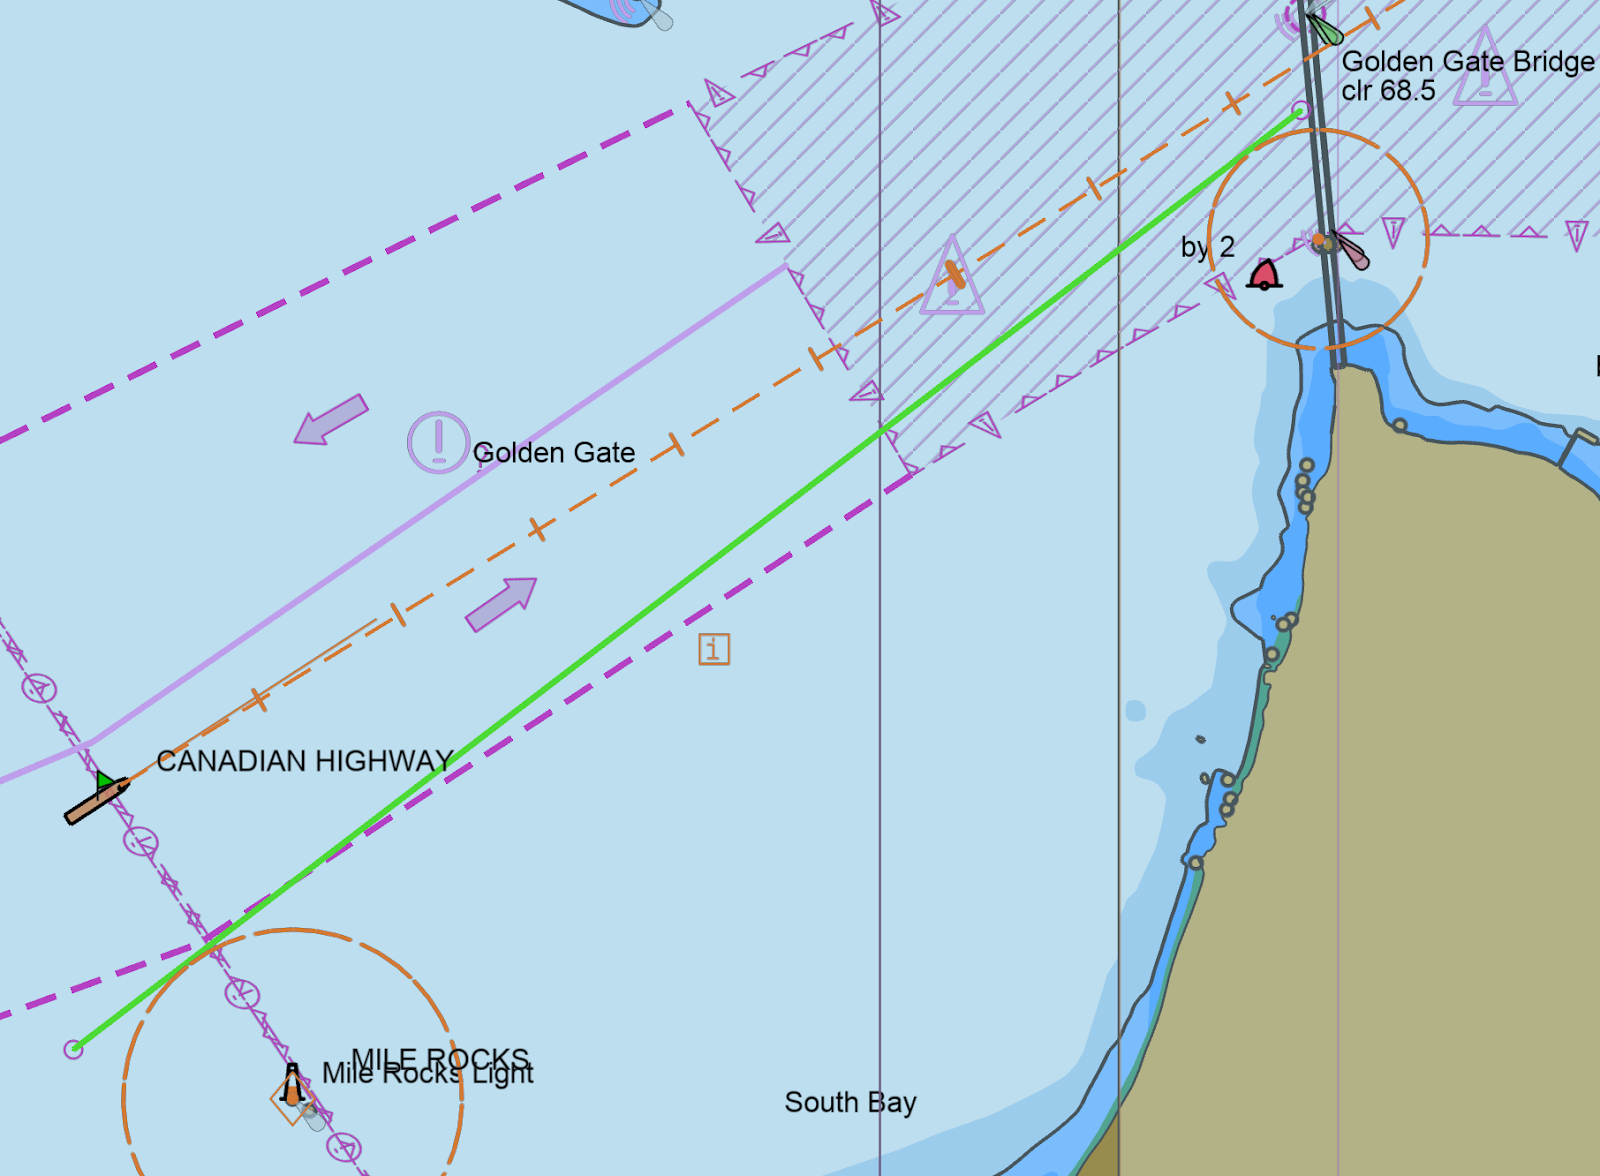
Chart Accuracy
I’ve recently seen a few forum threads with people inquiring about the accuracy of soundings on their charts, particularly when they are comparing multiple chart sources and the numbers don’t match exactly. Remember that every measurement contains a certain amount of error and safe navigation requires taking that accuracy into account. For example, a depth of 5 meters might, depending on the chart, really mean “5 m ± 1 m”.
Paper charts traditionally included Source Diagrams as a small insert that indicated the quality of data for different portions of the chart. With electronic charts that information is contained in the “Quality of Data” property and are standardized as CATZOC values (Category Zone of Confidence). A chart of the values and explanatory notes can be found at https://www.admiralty.co.uk/AdmiraltyDownloadMedia/Blog/CATZOC%20Table.pdf. (If you’re looking for something to print as a quick reference, a table that includes the corresponding ECDIS symbols can be found here.)
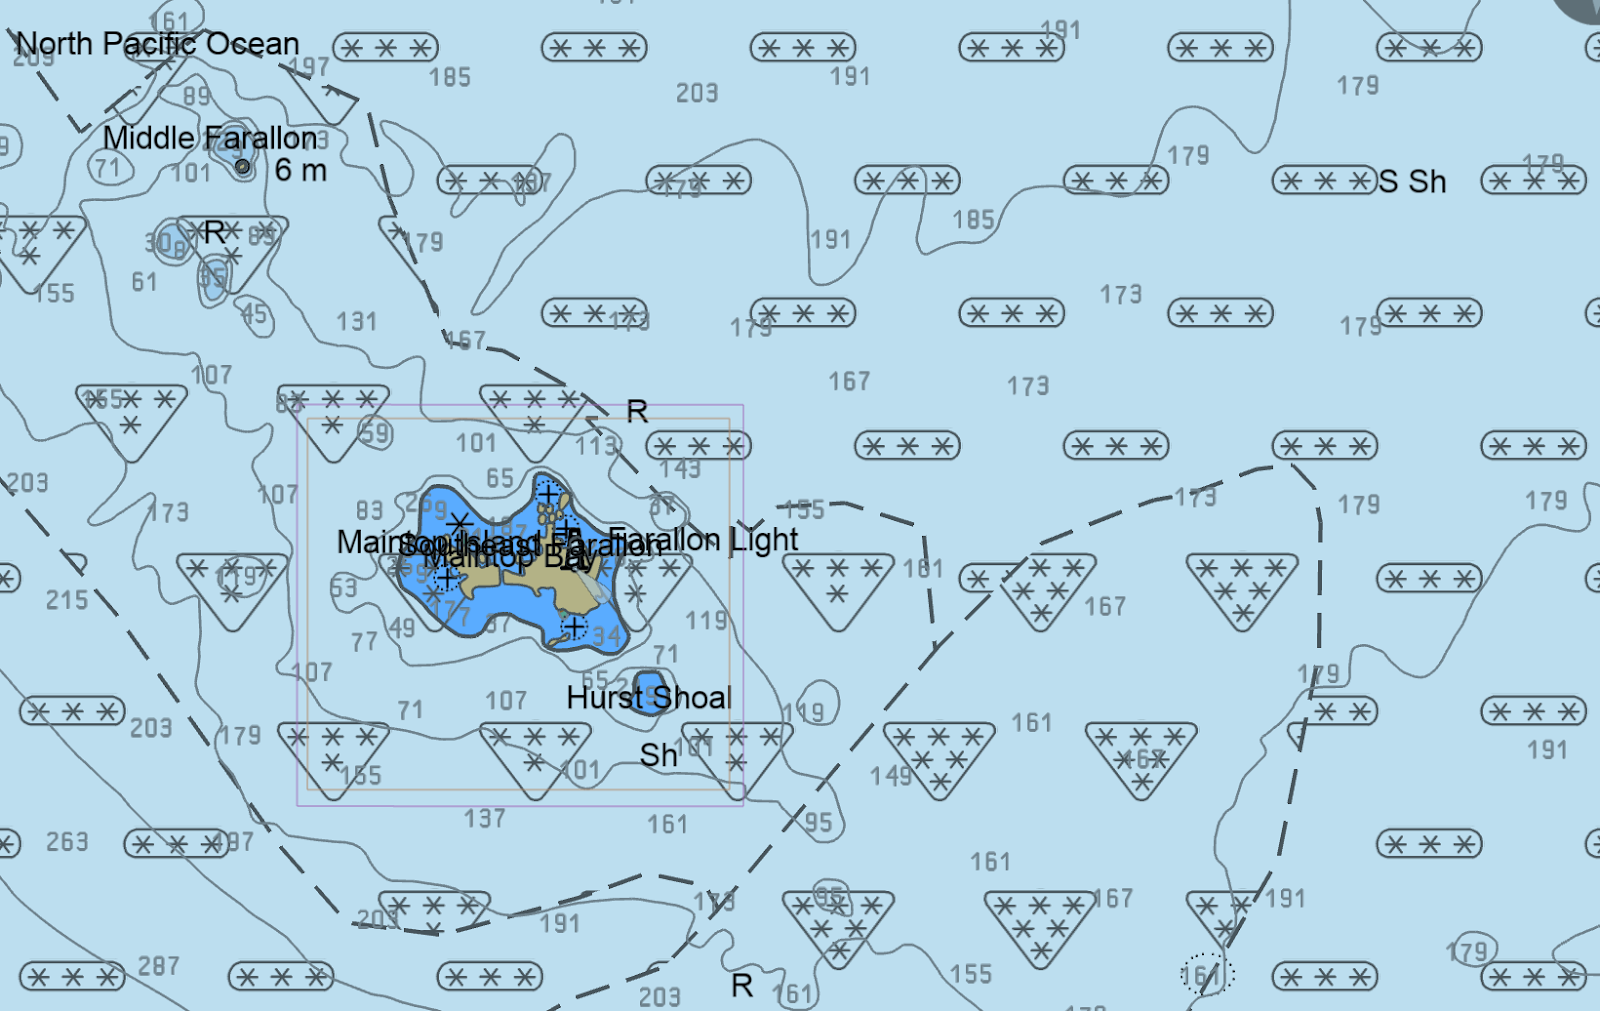
Below is an example of an electronic chart with the ZOC display enabled; 6 stars indicates the highest level (category A1) while three stars corresponds to category C, where positional accuracy is ± 500 m and depths should be read as ± 2 m + 5% of the charted value. If placing a VRM around a hazard in a Category C area, that means you should add an additional 500 m to the amount of safe space you wish to give it.
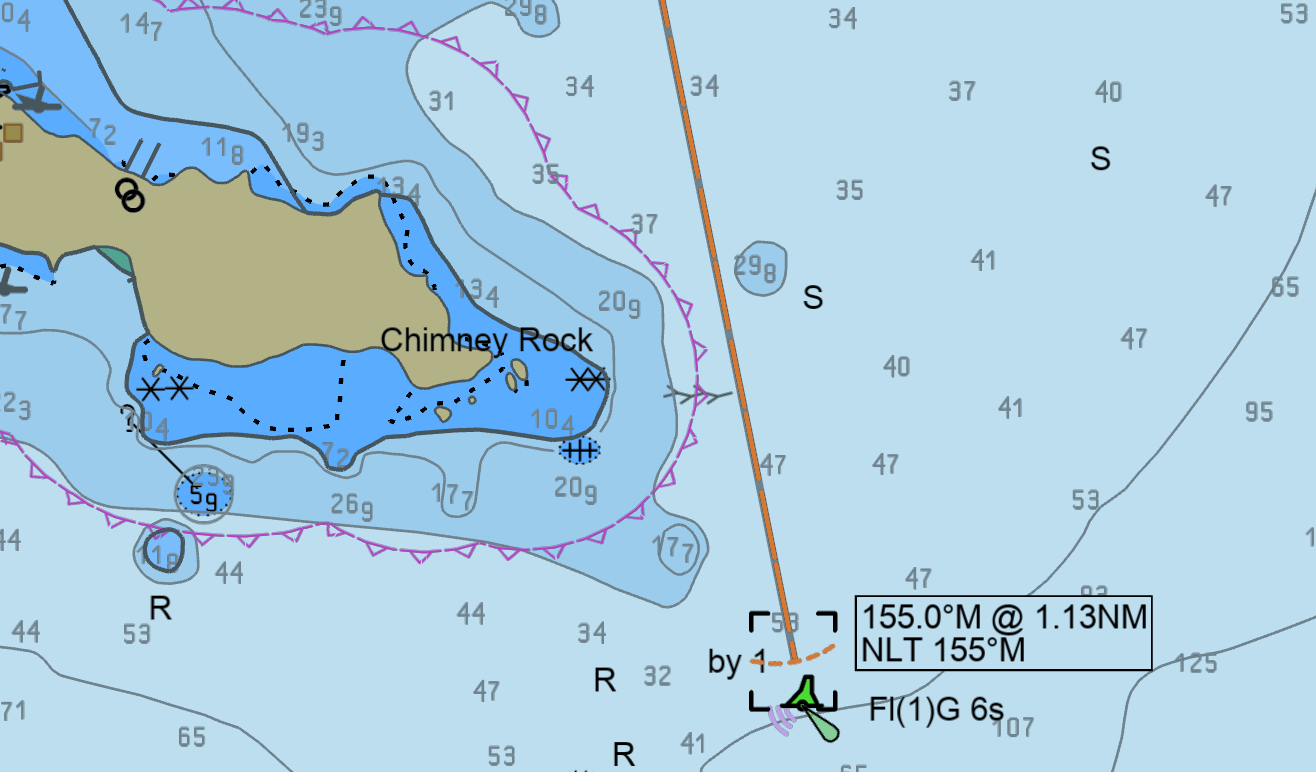
Danger Bearings
In the simplest case we can use an EBL to mark a danger bearing. Swing the origin of the line around a bit to verify whether a “no less than” or a “no more than” label is correct, then in the tool’s properties be sure to lock it from further editing.
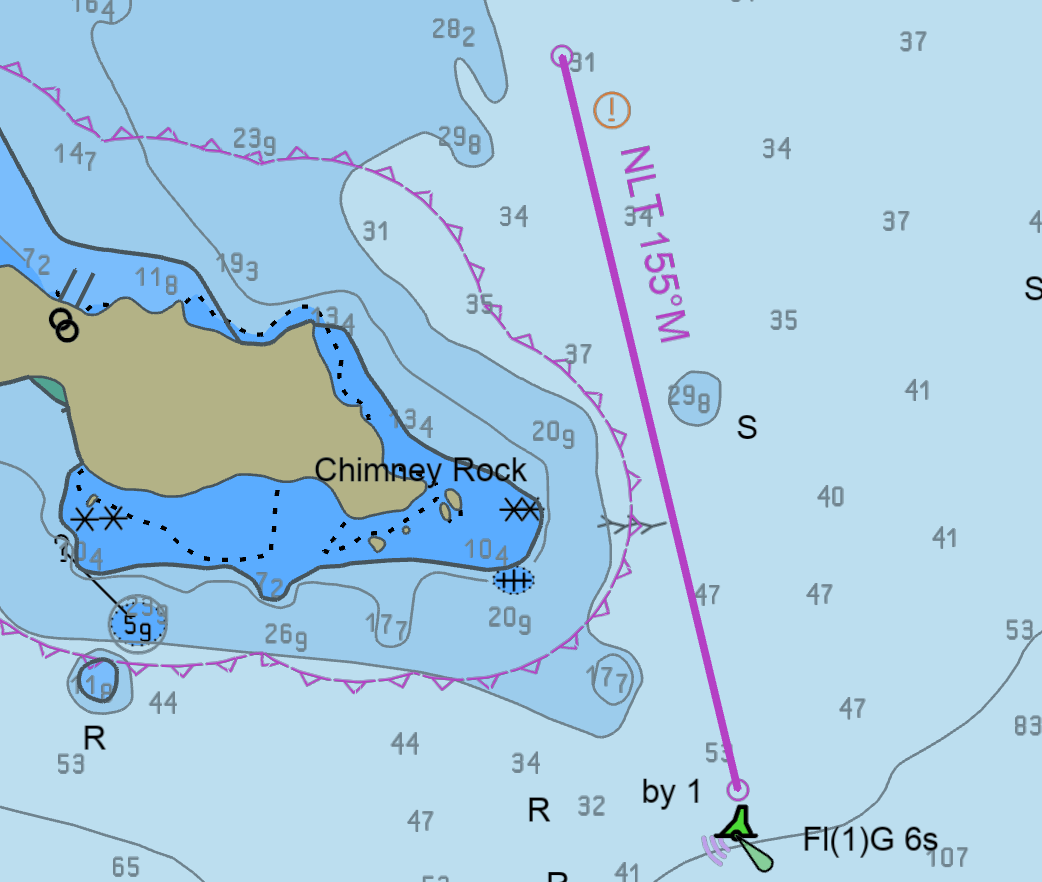
If you wish to get fancy, a mariner’s note will keep the text visible and allow customization of the line. It takes a bit more effort, but the text will stay visible at all times without having to select the tool. (Tip: use an EBL as a template to ensure the correct bearing and label, then delete it.)
Security Zones
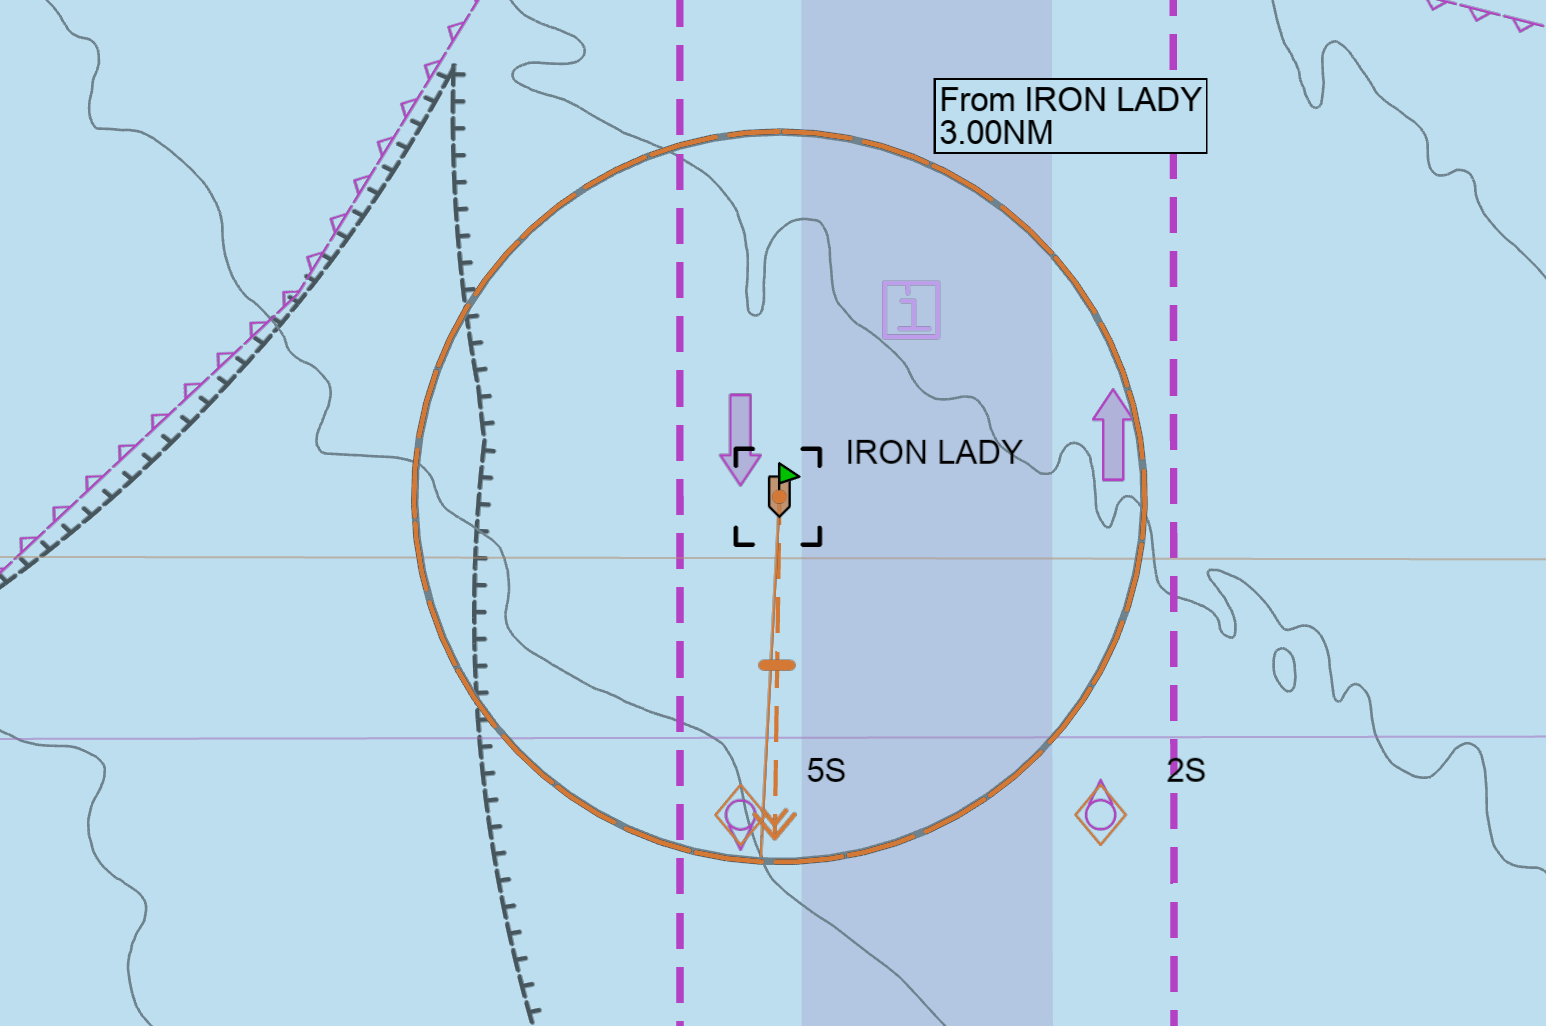
Some vessels, such as cruise ships and the military, have security zones around them. Attaching a VRM to them provides an easy reminder to maintain a safe distance.
Position Fixing
With paper charts it’s expected to plot fixes at regular intervals, and there’s little reason to stop that with electronic charts. For example, the questionnaire for tanker inspectors includes this guidance: “At least two methods of position fixing should be charted, where possible. Visual and radar position fixing and monitoring techniques should be used whenever possible. GPS derived positions should always be verified by alternative methods.”
Even though GPS data provides a continuous plot, position cross-checking should still be performed at regular intervals. The interval should be such that any deviation would be detected before it becomes too late to take corrective action. In some parts of the world, the island or reef on the chart might be someplace else in real life.
Radar Fix
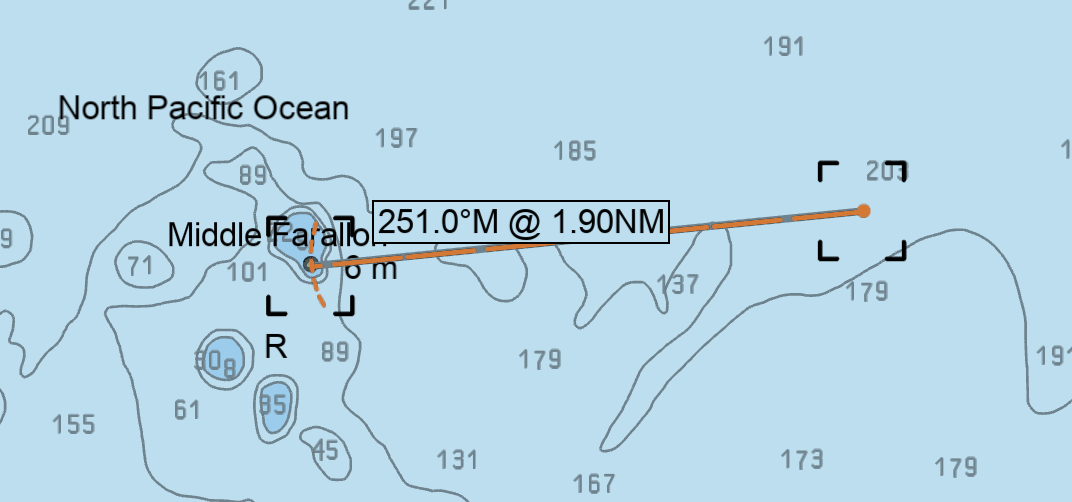
A radar fix is perhaps the simplest to plot; simply drop an EBL on the charted target and adjust the range and bearing to match the radar return. Once done, mark the point with the fix details:
Visual Fixes
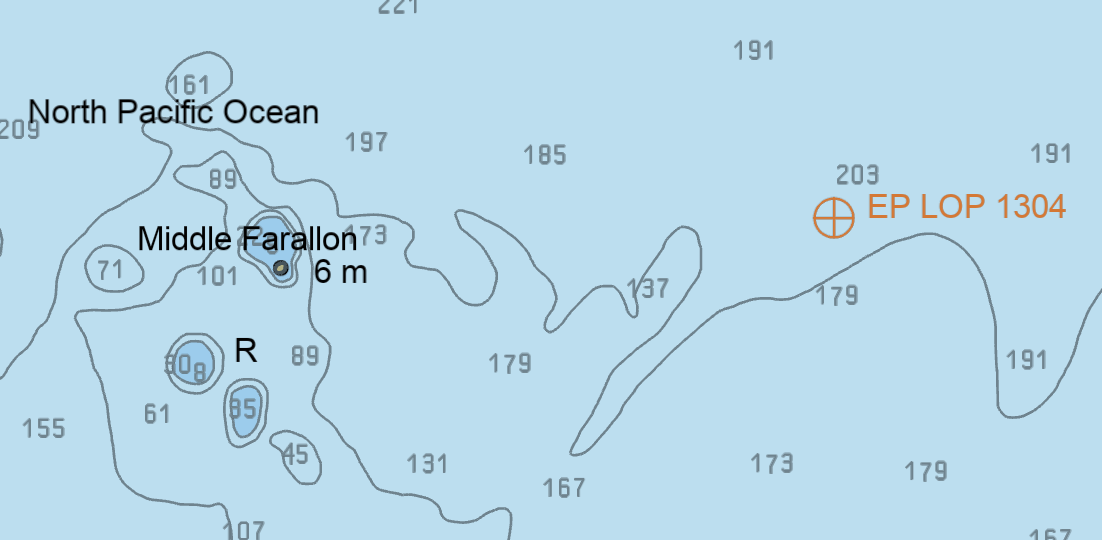
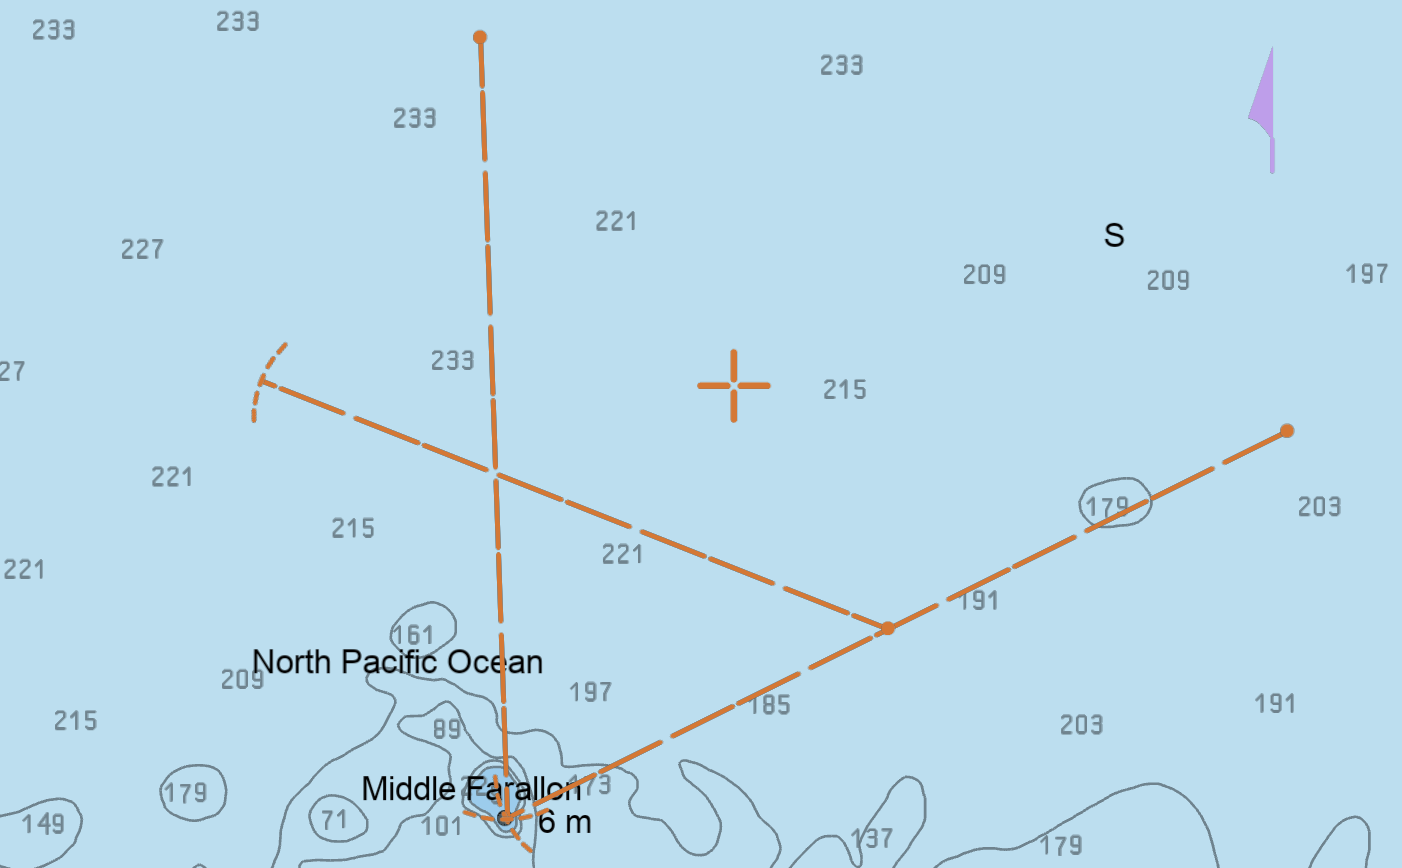
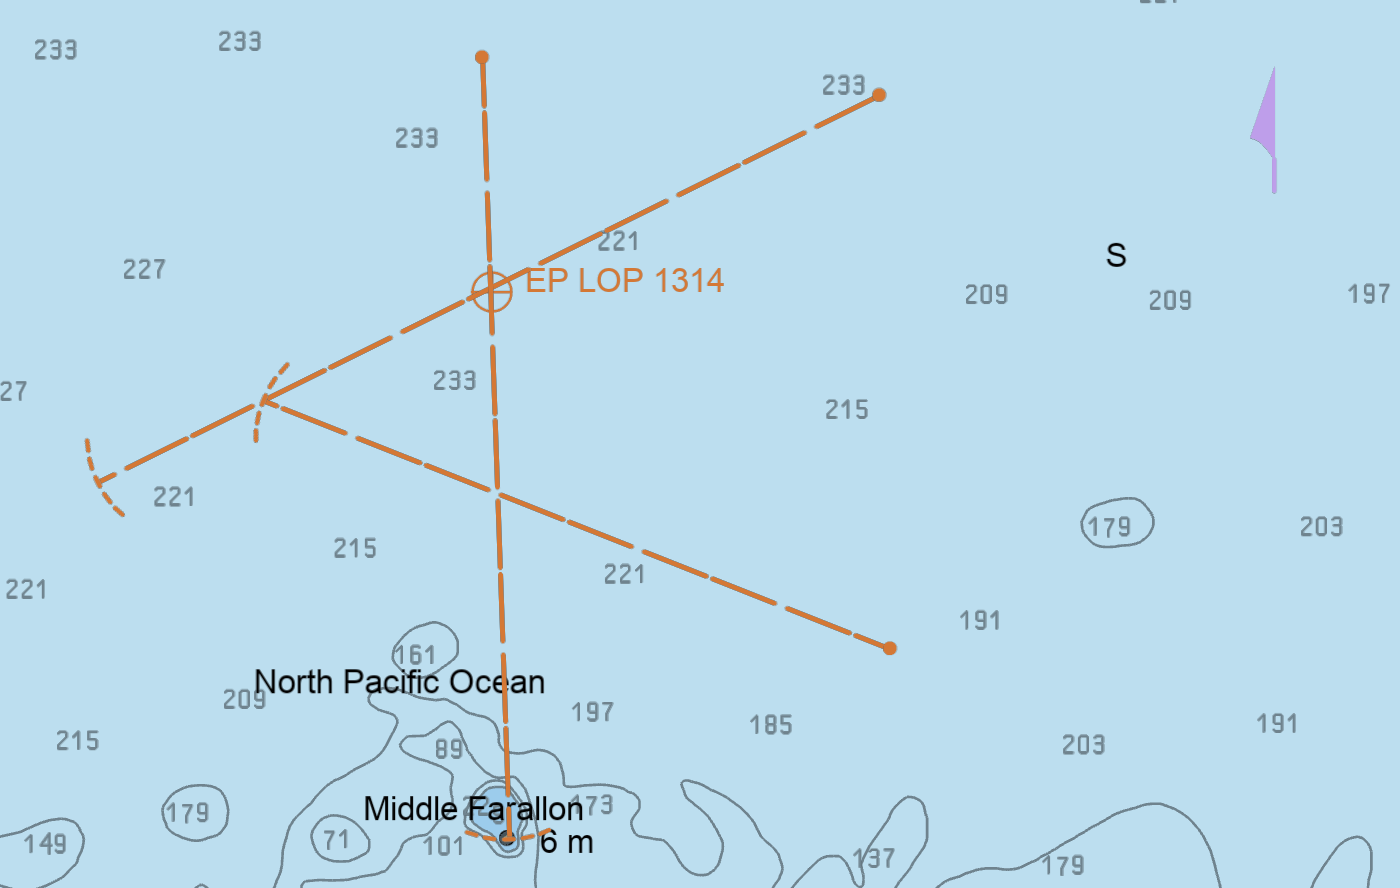
A visual fix can be similarly plotted, simply draw your EBLs with the appropriate bearings and mark the area of intersection. You can even do a running fix: plot EBLs for the measured bearings, then add a third with length and bearing corresponding to your course and speed. (Ensure the origin of the third EBL is somewhere along the first EBL.) Finally, transfer the original LOP to the endpoint of the third EBL and mark the point where the first and second LOPs intersect:
For further reading, check out this post on Position Fixing at https://www.myseatime.com/blog/detail/position-fixing-the-most-important-element-of-passage-planning.
GPS Reliability
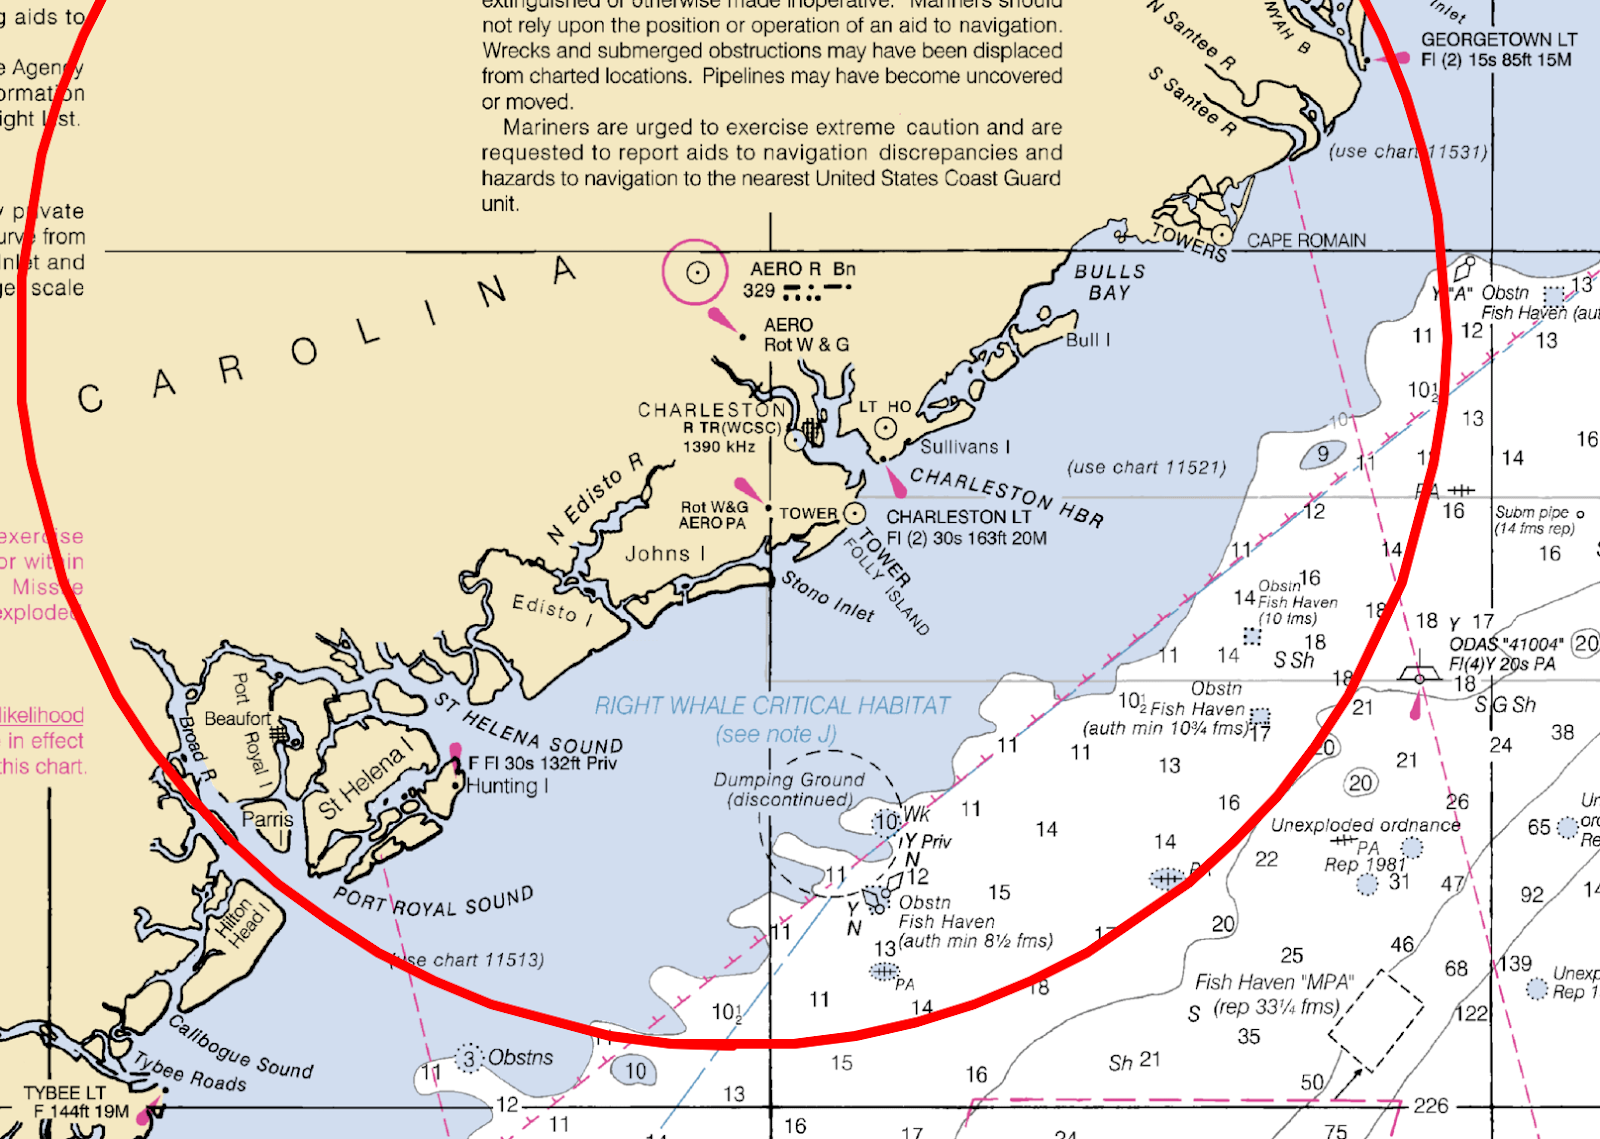
GNSS systems such as GPS, GLONASS, GALILEO, and others provide unprecedented location accuracy both day and night. Even so, it’s possible that they are not always there. While a sustained outage would likely have severe economic impacts, local interference happens from time to time (link). For example, shortly before writing this the local NTM for District 7 included this warning:
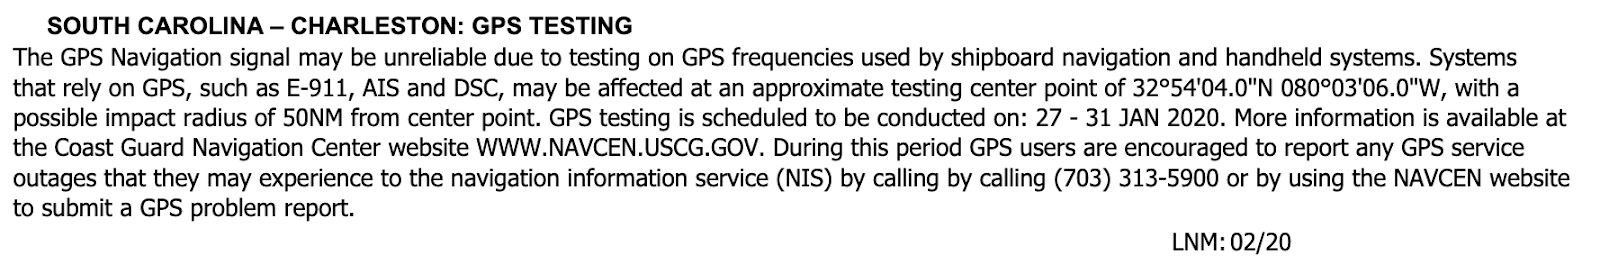
Here’s the area in scope:
Also, bear in mind that even though devices have the hardware to support multiple GNSS constellations, some may require software updates to allow their use within the US. For example, Galileo only received a waiver from the FCC in late 2018, and so many devices may still ignore Galileo signals while within US territory (link). (GLONASS appears to have snuck in before manufacturers considered this.)
Navigators should be observant for COG or SOG values that seem out of place, and in the planning phase should use satellite imagery to validate key positions on unfamiliar charts.
Course Vectors
Course vectors are a very useful tool for determining where a vessel is likely to be in the future. The examples below use 12 minute vectors, meaning the arrow indicates where the vessel will be 12 minutes from now. The greater the length, the greater the speed. Note that they don’t account for future course changes, and in-progress course changes are likely to be continuously changing.
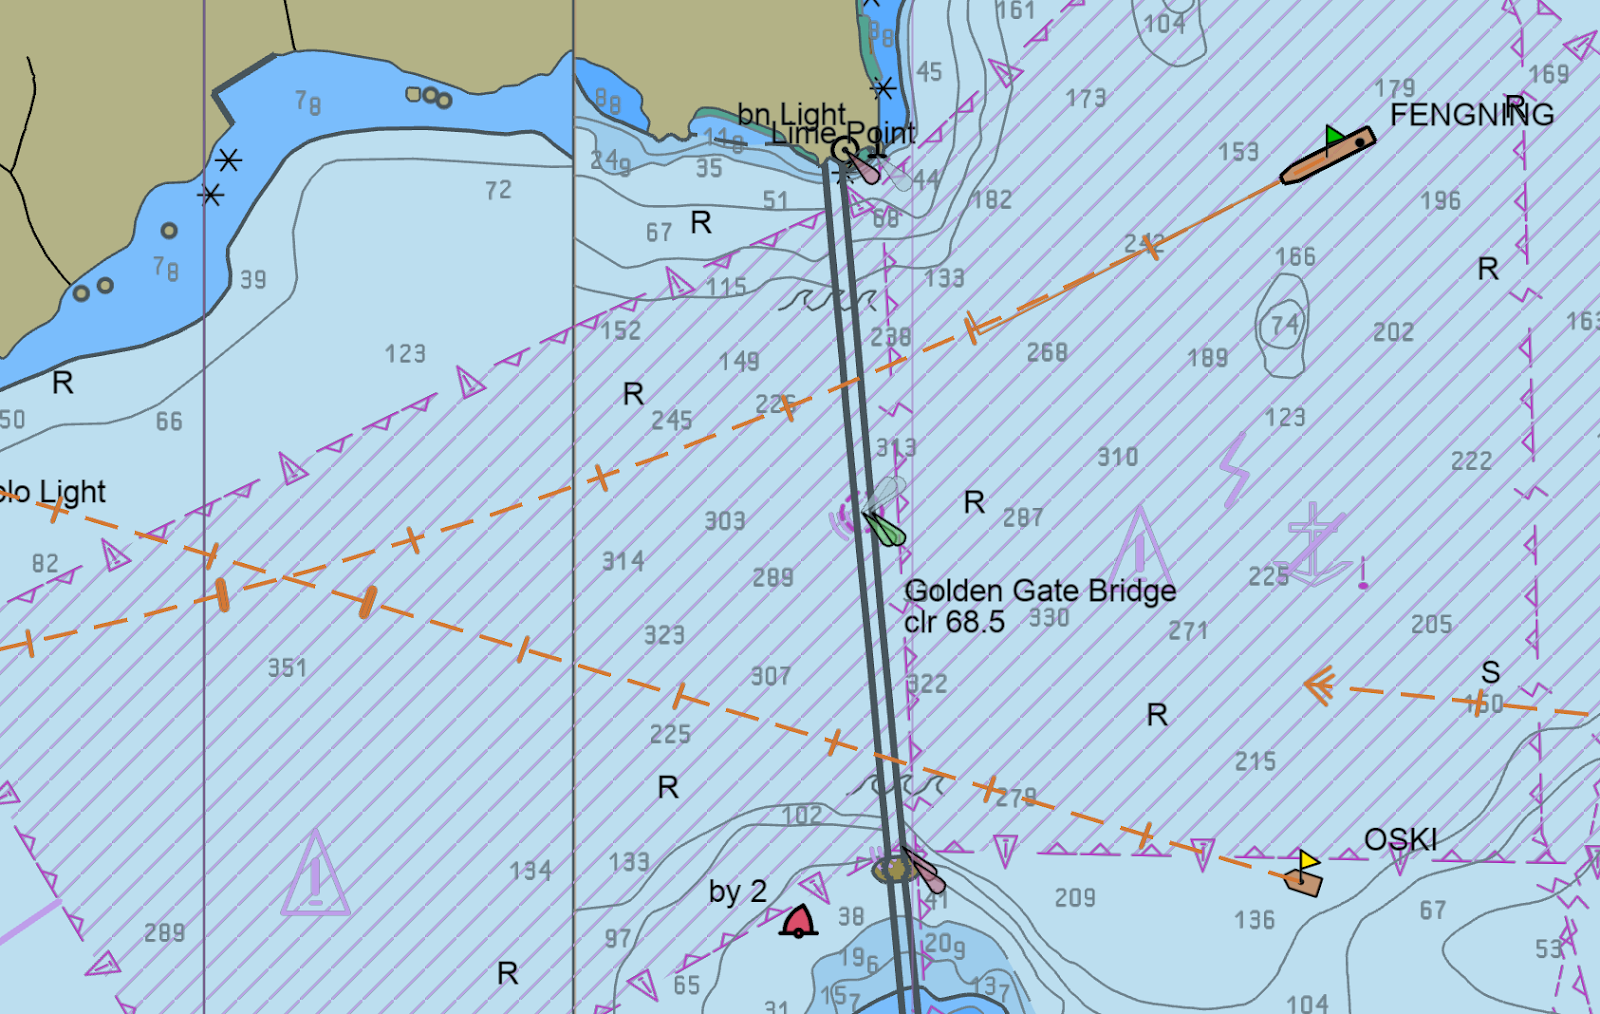
Crossing Vectors
Just because course vectors cross does not imply a collision, but it does indicate taking a closer look. What you want to avoid are vectors that cross at the same time point; e.g. both vectors crossing at their respective 6-minute ticks implies both vessels attempting to occupy the same space in 6 minute’s time: rarely a good idea.
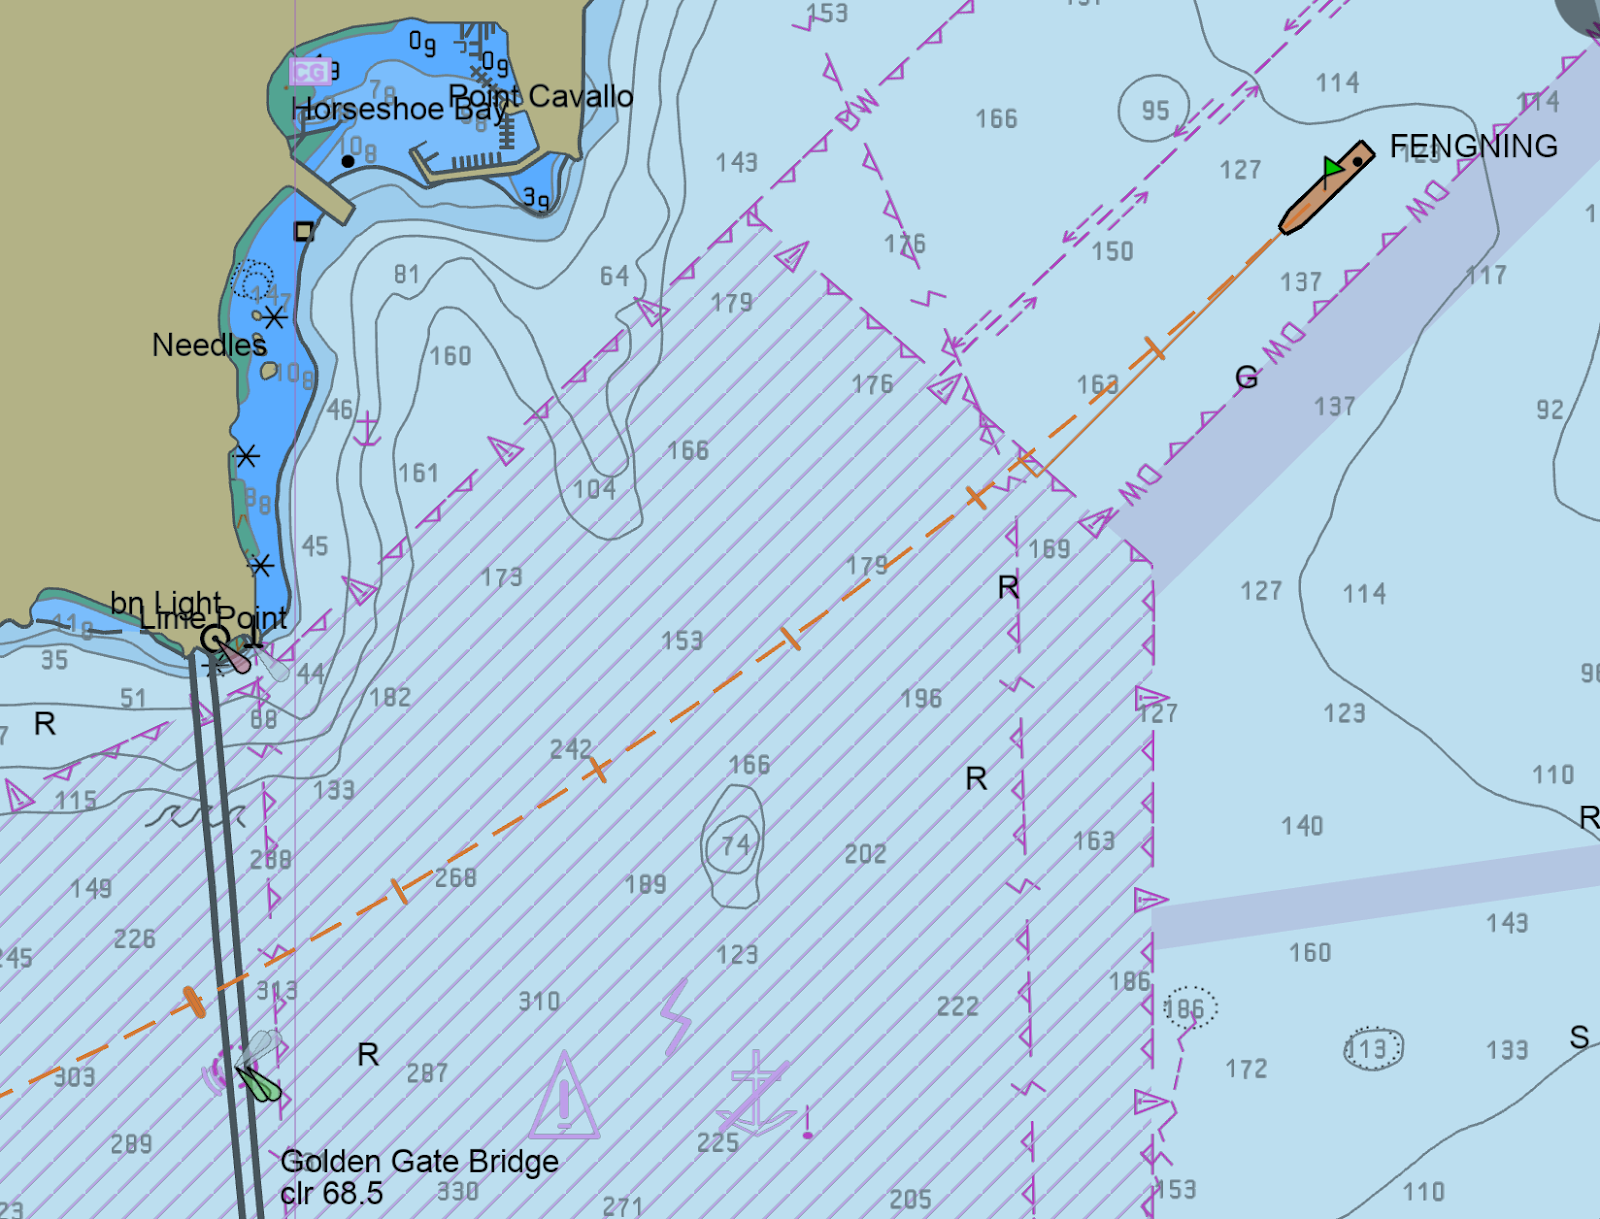
Here both Oski and Fengning are heading out the gate, and the 6 minute ticks on their vectors are uncomfortably close. If this persisted it’d be cause for concern, but here we can see that Oski is likely just avoiding the south tower of the bridge, (and may not head out the gate anyway).
Rate of Turn Display
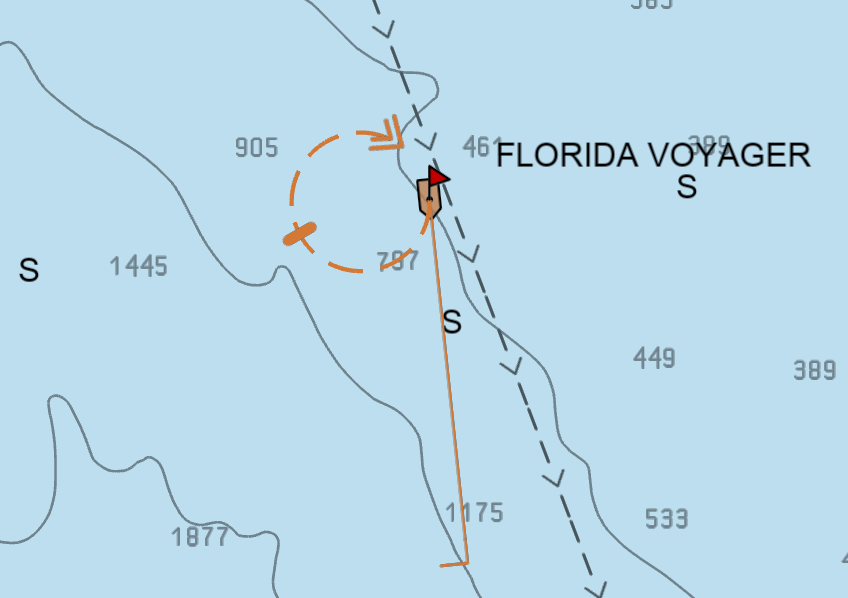
Here Florida Voyager indicates a 26° / minute turn rate. With our 12 minute vectors, after 12 minutes she will have turned 312°, or almost a full circle, assuming she continues turning at that rate. (Many vessels are not able to provide rate-of-turn data.)
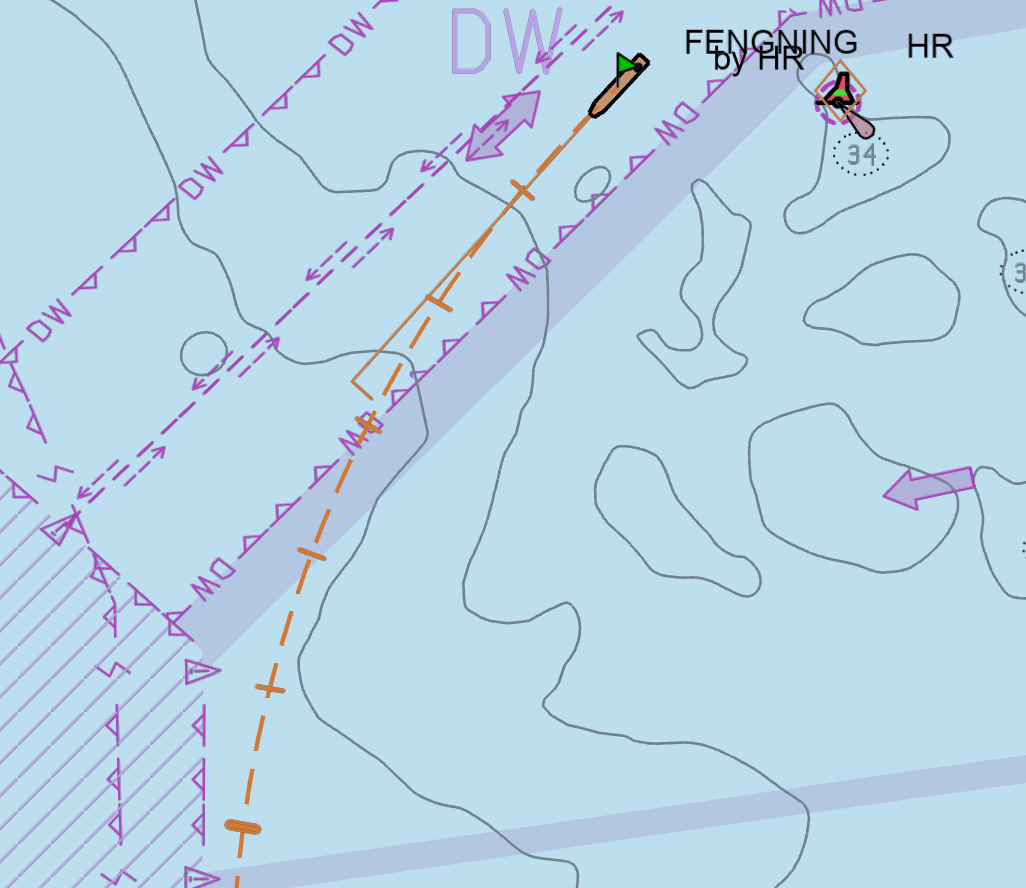
Here Fengning completes a turn past Harding Rock; eventually her course should straighten as she makes for the Gate, and indeed we see the adjustment soon after: